
Introduction
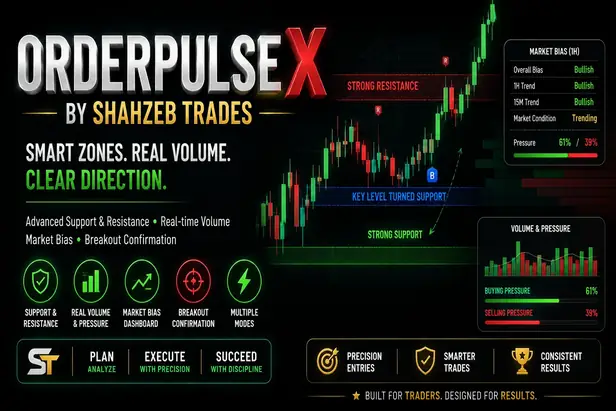
OrderPulse X is a TradingView indicator by SHAHZEB TRADES built for traders who want more context than a basic Support and Resistance indicator can provide.
The idea behind OrderPulse X is straightforward: instead of looking at price levels in isolation, the indicator brings together dynamic Support and Resistance zones, volume activity, estimated buyer and seller pressure, price reactions, breakout behavior, and market bias in one trading interface.
That matters because a Support or Resistance level alone does not tell the complete story. A trader still needs to know what price is doing when it reaches that level.
Is price strongly rejecting it?
Is buying pressure increasing?
Is volume supporting the move?
Is the level actually breaking?
Or is it just another false breakout?
OrderPulse X is designed to help traders work through those questions before making a decision.
Table of Contents
What Is OrderPulse X?
OrderPulse X is an advanced TradingView market-analysis indicator created by SHAHZEB TRADES.
The public TradingView page describes it as a system for visualizing live order activity, buyer and seller pressure, dynamic Support and Resistance zones, market liquidity and flow analysis, real-time market strength, and price-action confirmation. It is currently published as an invite-only script on TradingView.
The important part is understanding what all of those components are trying to achieve.
OrderPulse X is not supposed to replace your entire trading process with one arrow on the chart.
Instead, it is designed to organize several pieces of information around the current market:
Price → Zone → Volume → Pressure → Reaction → Confirmation
That makes it easier to read what is happening around important levels.
Why OrderPulse X Is Different
A normal Support and Resistance tool may draw horizontal levels and leave the trader to interpret the rest.
That can work, but it also creates a problem: not every level deserves the same attention.
A fresh reaction zone is different from an old, repeatedly broken level.
A strong rejection accompanied by increasing volume is different from a weak reaction during low activity.
And a candle that briefly moves through Resistance is not necessarily the same thing as a confirmed breakout.
OrderPulse X tries to bring these pieces together so the trader can focus on market context rather than one isolated signal.
The indicator is particularly useful for traders who want their chart to answer three questions:
Where is the important level?
Identify the Support or Resistance area where price may react.
What is happening at that level?
Observe price action, volume and estimated buying or selling pressure.
Is the move actually confirmed?
Look for confluence, breakout confirmation or a failed reaction before considering an entry.
OrderPulse X Trading Modes
One of the most useful parts of the indicator is that it does not force every trader to use the same sensitivity.
OrderPulse X includes four modes:
- Scalper
- Short Intraday
- Intraday
- Custom
Each mode changes the way the indicator filters zones and confirmations.
That matters because a 1-minute scalper and a 1-hour intraday trader should not be reading the market with exactly the same sensitivity.
OrderPulse X for Scalping

Who Is Scalper Mode For?
Scalper Mode is designed for traders working primarily on lower timeframes such as 1M, 3M and 5M.
The market moves quickly on these charts, so an indicator that is too slow can become less useful. At the same time, excessive sensitivity can create a huge amount of noise.
The Scalper preset is therefore more responsive to recent price action.
Its main preset characteristics include:
- Pivot Length: 7
- Minimum Zone Strength: 15%
- Maximum Visible Zones: 4
- Live Touch Sensitivity: 0.20 ATR
- Zone Merge Distance: 0.10 ATR
- Age Maturity: 20 bars
- Breakout Confirmation: 2 bars
- Required Confluence: 2 factors
- Minimum Relative Volume: 1.1x
- HTF Trend Filter: Off
- Pressure Lookback: 10 bars
How to Read Scalper Mode
A simple approach is:
Zone → Reaction → Pressure → Volume → Confirmation
For example, suppose price approaches a Support zone.
You do not have to buy simply because Support exists.
Instead, you can watch whether price rejects the zone, whether buying pressure improves, whether volume supports the reaction, and whether the broader setup provides enough confluence.
That is the difference between using an indicator and understanding what the indicator is showing.
OrderPulse X for Short Intraday Trading

Short Intraday Mode sits between fast scalping and broader intraday analysis.
It is designed for traders who want stronger filtering before acting on a setup.
The preset uses:
- Pivot Length: 12
- Minimum Zone Strength: 30%
- Maximum Visible Zones: 5
- Live Touch Sensitivity: 0.30 ATR
- Zone Merge Distance: 0.125 ATR
- Age Maturity: 35 bars
- Breakout Confirmation: 3 bars
- Required Confluence: 3 factors
- Minimum Relative Volume: 1.2x
- HTF Trend Filter: On
- Primary HTF Context: 15M
- Secondary HTF Context: 5M
- Pressure Lookback: 20 bars
A practical workflow is:
15M → understand context
5M → wait for confirmation
This gives the trader more structure than simply reacting to every candle.
OrderPulse X for Intraday Trading

Intraday Mode is designed for traders who prefer fewer, more selective setups based on stronger market structure.
The preset increases the filtering further:
- Pivot Length: 20
- Minimum Zone Strength: 45%
- Maximum Visible Zones: 6
- Live Touch Sensitivity: 0.40 ATR
- Age Maturity: 60 bars
- Breakout Confirmation: 4 bars
- Required Confluence: 4 factors
- Minimum Relative Volume: 1.3x
- HTF Trend Filter: On
- Primary HTF Context: 1H
- Secondary HTF Context: 15M
- Pressure Lookback: 30 bars
This mode is designed to ignore much of the smaller market noise and focus on zones that have more significance.
A practical framework is:
1H → market context
15M → confirmation
The goal is not to create more opportunities.
It is to become more selective about which opportunities deserve attention.
Custom Mode
Some traders do not want a fixed preset.
That is where Custom Mode becomes useful.
Custom Mode allows traders to adjust the sensitivity of important components according to their own strategy and market.
Depending on the implementation, the key areas include:
- Pivot sensitivity
- Zone strength
- Number of visible zones
- Live touch sensitivity
- Zone merging
- Zone maturity
- Breakout confirmation
- Required confluence
- Relative volume
- Higher-timeframe trend filtering
- Pressure lookback
The important thing is not to change everything randomly.
A better approach is to understand what each parameter changes before optimizing it.
How Support and Resistance Zones Work
Support and Resistance are at the core of OrderPulse X.
The indicator uses confirmed pivot highs and pivot lows to identify potential areas where price may react.
There is an important detail here: pivot-based levels are naturally confirmed with some delay.
Why?
Because a pivot needs price action on both sides before it can be confirmed.
That means a confirmed zone can be more structurally meaningful, but it also means the indicator cannot magically know about a future pivot before the required candles exist.
This is an important distinction between confirmation and prediction.
Zone Deduplication and Clustering
When multiple potential levels appear very close together, displaying every single one can make the chart messy.
OrderPulse X therefore uses distance filtering and zone handling to reduce unnecessary duplication.
This helps the chart remain readable and makes stronger areas easier to identify.
Zone Strength
A zone can become more significant as the market interacts with it.
The system can consider factors such as:
- Retests
- Volume
- Buying volume
- Selling volume
- Recency
- Age
- Historical interaction
The practical result is that traders can pay more attention to stronger zones instead of treating every level equally.
Understanding Volume and Pressure
Volume is useful, but the important question is how it is interpreted.
OrderPulse X estimates buying and selling pressure from available price and volume information.
A candle that closes closer to its high contributes more toward estimated buying activity, while a candle closing closer to its low contributes more toward estimated selling activity.
An Important Clarification
This pressure calculation should not be confused with direct exchange Level-2 order-book data.
The indicator is working with data that Pine Script can access and derive from the chart.
So when OrderPulse X shows buyer/seller pressure, it is more accurate to understand that as estimated pressure based on price and volume behavior, rather than a literal feed of every order sitting in the order book.
That distinction makes the tool easier to use realistically.
How Breakout Confirmation Works

One of the strongest concepts in OrderPulse X is the difference between a level being crossed and a breakout actually holding.
Suppose price moves above Resistance.
That first movement does not automatically prove that the market has accepted prices above the zone.
Price could:
- Break the level.
- Attract buyers.
- Immediately fall back inside the zone.
- Continue lower.
That is a failed breakout.
OrderPulse X addresses this by classifying breakout development as:
B ? — Potential Break
B ✓ — Confirmed Break
B ✗ — Failed Break
The system evaluates what happens after the initial break rather than treating the first move through the level as final confirmation.
That gives traders another layer of context when dealing with false breakouts.
BUY and SELL Confluence
The confluence system is where the different parts of OrderPulse X start working together.
Instead of saying:
“Price touched Support, so BUY.”
the system can look for several factors to agree.
Potential confirmation factors include:
- Rejection candle
- Estimated pressure
- Relative volume
- Momentum
- Higher-timeframe trend alignment
The required number of factors depends on the selected mode.
Scalper
Lower confirmation requirement because the mode is designed for faster setups.
Short Intraday
Moderate confirmation requirement with higher-timeframe context enabled.
Intraday
Higher confirmation requirement for more selective setups.
This creates an important principle:
More confirmation does not mean more signals. It usually means fewer signals with stricter requirements.
That is intentional.
Understanding the Market Bias Dashboard

OrderPulse X also provides a market-bias layer that gives the trader more context.
The dashboard can evaluate:
- Higher-timeframe EMA direction
- ADX-based trend strength
- Buy/sell volume relationship
- Higher-timeframe market conditions
The higher-timeframe context changes with the trading mode.
For faster styles, the context is closer to the active trading timeframe.
For Intraday Mode, the system looks further out toward 1H and 15M structure.
This creates a useful separation:
Lower timeframe = execution
Higher timeframe = context
The dashboard is therefore not meant to replace your chart analysis. It is there to make the broader context easier to see.
How to Use OrderPulse X on a Trading Chart
The cleanest way to use OrderPulse X is not to look for one magical signal.
Think in stages.
Step 1: Select the Correct Mode
Choose the mode that matches your actual trading style.
Do not choose Intraday Mode and then trade every 1-minute movement.
Do not use Scalper Mode and expect it to behave like a 1H structural indicator.
Step 2: Find the Important Zone
Look for meaningful Support and Resistance.
Ask:
Where is price likely to react?
Step 3: Wait for Price to Reach the Area
This is where patience matters.
There is no need to chase price in the middle of nowhere when a well-defined zone is nearby.
Step 4: Read the Reaction
Now observe:
- Candle rejection
- Pressure
- Volume
- Momentum
- Breakout behavior
Step 5: Look for Confluence
The strongest setups are generally the ones where multiple independent factors point in the same direction.
Step 6: Define Risk Before Entry
Only after the setup makes sense should you think about execution.
Stop loss, position size and maximum risk should already be clear.
Common Mistakes to Avoid
Taking Every Zone as a Trade
A zone is an area of interest, not an automatic entry.
Entering on the First Break
A first push through Support or Resistance can still fail.
Wait for confirmation where your strategy requires it.
Treating Pressure as Perfect Order Flow
Estimated pressure is useful context, but it is not the same as having a complete Level-2 order book.
Changing Settings After Every Loss
One losing trade does not prove that the indicator settings are wrong.
Constantly changing parameters can make your process less consistent.
Ignoring the Higher Timeframe
Lower-timeframe signals can look attractive while the broader structure is moving the other way.
That is one reason Short Intraday and Intraday modes include higher-timeframe context.
Overtrading
More information does not mean you need more trades.
Sometimes the best use of an indicator is knowing when not to enter.
Is OrderPulse X a Complete Trading Strategy?
No.
And that is an important point.
OrderPulse X is an analysis and decision-support tool.
It can help organize market information, highlight zones, show pressure and volume context, and provide confirmation signals.
But it cannot remove uncertainty from financial markets.
A trader still needs a complete process covering:
- Market selection
- Setup rules
- Entry rules
- Stop loss
- Position sizing
- Risk management
- Trading psychology
- News awareness
- Trade management
Think of OrderPulse X as a better dashboard for your decision-making process, not a machine that guarantees the outcome of every trade.
OrderPulse X on TradingView

OrderPulse X By SHAHZEB TRADES is available on TradingView as an invite-only script. The current public TradingView listing presents the indicator around live market visualization, buyer/seller pressure, dynamic Support and Resistance, liquidity/flow analysis, market strength and price-action confirmation.
You can view the official TradingView page here:
OrderPulse X By SHAHZEB TRADES on TradingView
TradingView also notes on the listing that invite-only scripts require approval from the author for access.
Final Thoughts
OrderPulse X is built around a simple trading idea: one piece of information is rarely enough.
A Support level is useful.
Volume is useful.
Buying and selling pressure is useful.
A breakout is useful.
Higher-timeframe bias is useful.
But when these pieces are considered together, they can give the trader a much clearer picture of what is happening around price.
That is where OrderPulse X is most useful.
Use Scalper Mode when you need faster sensitivity.
Use Short Intraday Mode when you want a balance between speed and confirmation.
Use Intraday Mode when you want stronger filtering and broader market context.
And use Custom Mode when you already understand exactly what you want to optimize.
The goal is not to predict every candle.
The goal is to read the market better, wait for confirmation, and manage risk when the market does not behave as expected.
Trade with information. Read the flow. Understand the market.
Learn more, improve your market understanding, and discover the latest resources from Shahzeb Trades.


