
August 31, 2026
Table of Contents
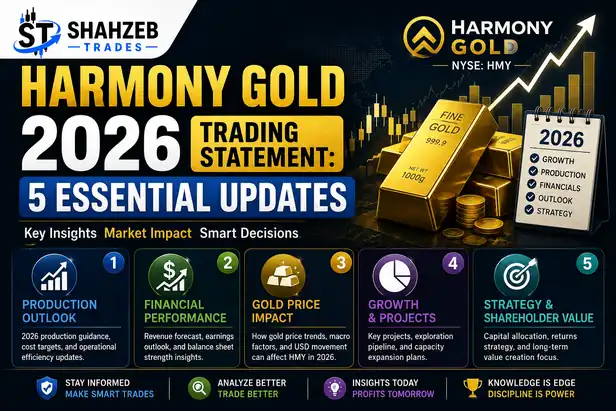
harmony gold 2026 trading statement: 5 Essential Updates
Last Updated: August 2026
Introduction
The harmony gold 2026 trading statement released on August 21, 2026 gave investors an early view of Harmony Gold Mining Company’s FY26 operating performance before the company published its full annual results on August 27. The statement covered the financial year ended June 30, 2026 and highlighted stronger earnings, gold production in line with guidance and the growing contribution of copper.
For traders watching gold-related equities, the announcement matters because Harmony’s results are influenced by more than the gold price alone. Production levels, costs, exchange rates, copper output, capital spending and balance-sheet decisions can all affect how the market interprets the company.
This guide breaks down the harmony gold 2026 trading statement in practical terms and separates the headline numbers from the factors that may matter for future trading decisions.
harmony gold 2026 trading statement: What changed?
The first important point is that the August 21 statement was a trading statement and operating update, not the final audited annual-results release. Harmony said a reasonable degree of certainty existed that FY26 basic earnings and headline earnings would be materially higher than the prior comparable period. The company then published the full FY26 results on August 27.
The trading statement indicated:
- FY26 gold production of 44,464kg, or 1,429,551 ounces, in line with guidance.
- Underground recovered grade of 5.83g/t, in line with guidance.
- Gold all-in sustaining cost of R1,191,698/kg or US$2,195/oz, within guidance.
- CSA copper production of 18,207 tonnes, toward the upper end of guidance.
- Expected FY26 EPS of 4,400–4,800 South African cents.
- Expected FY26 HEPS of 4,050–4,450 South African cents.
The full results subsequently confirmed the broad direction and provided final reported figures.
Gold production and operating performance
The most straightforward takeaway from the harmony gold 2026 trading statement is that Harmony met its gold production guidance.
FY26 production reached 1,429,551 ounces, compared with 1,479,671 ounces in FY25, a decline of about 3%. That decline is important because it shows that the improvement in financial performance was not primarily driven by producing more gold. Instead, substantially higher realized gold prices did much of the work.
Harmony reported an average gold price received of US$3,811 per ounce in FY26, up from US$2,620/oz in FY25. That is a 46% increase in US-dollar terms. At the same time, AISC increased to US$2,195/oz from US$1,804/oz.
That distinction matters for anyone analyzing the company.
Higher gold prices improve revenue and margins, but rising costs can absorb part of the benefit. Therefore, the stronger FY26 earnings should not automatically be interpreted as evidence that the underlying mining operation became dramatically more productive.
For traders, the more useful framework is to track the relationship between:
Gold price → realized price → production → costs → cash flow
That approach is more informative than looking at the share price alone.
Readers researching gold-market fundamentals can also compare company-level results with broader developments in gold trading, particularly when assessing whether a move in a gold-mining stock is being driven by the underlying metal or by company-specific news.
Earnings guidance and what it means
The harmony gold 2026 trading statement initially projected a substantial year-on-year increase in earnings.
Harmony expected FY26 EPS of 4,400–4,800 SA cents, representing an increase of approximately 90% to 108% from the prior comparable period’s 2,313 SA cents. Expected HEPS was 4,050–4,450 SA cents, representing a 73% to 90% increase from 2,337 SA cents.
The final results later showed reported FY26 HEPS of 4,363 SA cents, an 87% increase from 2,337 SA cents in the restated FY25 comparison. Basic EPS came in at 4,701 SA cents.
There is an important analytical lesson here.
A large earnings increase does not necessarily mean the company produced substantially more metal. In Harmony’s case, the final results showed gold production down 3%, while the average gold price received rose sharply. Group revenue increased 34% to R99.238 billion, and headline earnings increased 87% to R27.238 billion.
So the major earnings driver was the combination of higher commodity pricing and operational delivery, rather than a large production expansion.
Investors should therefore avoid evaluating the harmony gold 2026 trading statement only by its percentage earnings growth. The quality and durability of that growth depend partly on future commodity prices and the company’s ability to manage costs.
Copper production becomes more important
One of the biggest structural developments in the harmony gold 2026 trading statement is Harmony’s increasing exposure to copper.
The CSA mine in Australia contributed 18,207 tonnes of copper in FY26, with a recovered grade of 3.75% and a C1 cash cost of US$2.47/lb. Harmony said the production figure was toward the upper end of its guidance.
This matters because Harmony is no longer simply a South African gold producer in strategic terms. The company is building a diversified portfolio that includes gold and copper.
The company’s FY26 results also highlighted progress at the Eva Copper Project and the continued development of its copper portfolio.
For a market participant, diversification creates both potential benefits and additional variables.
Gold prices remain important, but copper prices, Australian operations, project execution and capital allocation now have a greater influence on the company’s longer-term outlook.
That means someone reading the harmony gold 2026 trading statement should not treat HMY or HAR as a simple proxy for spot gold.
Costs, cash flow and the balance sheet
Another major feature of the harmony gold 2026 trading statement is that strong revenue growth came alongside higher costs.
Final FY26 results showed group AISC increasing 13% to R1,191,698/kg, or US$2,195/oz. Meanwhile, the average gold price received increased by 35% in rand terms and 46% in US-dollar terms.
The cost increase reflects the reality of mining economics. Harmony cited higher production costs related to inflation in consumables and electricity, contractor costs and labour costs. The company also reported higher royalty and taxation expenses because of increased profitability.
Despite higher costs, the cash-generation picture was strong.
Harmony reported adjusted free cash flow of R17.148 billion, up 54% from R11.142 billion in the prior year. It ended FY26 with R852 million of net debt and liquidity of R17.101 billion, including cash and undrawn facilities.
That gives the harmony gold 2026 trading statement a second layer beyond the earnings headline: cash generation and financial flexibility.
When reviewing mining stocks, this is important because accounting earnings alone do not show how much cash remains available for dividends, capital expenditure, acquisitions or debt management.
For a broader framework on controlling downside when trading volatile markets, see the risk management guide.
FY27 guidance and the next phase
The harmony gold 2026 trading statement needs to be read alongside the company’s FY27 outlook because future guidance is often more relevant to valuation than the headline from the previous year.
Harmony’s FY27 guidance calls for:
| Metric | FY27 Guidance |
|---|---|
| Gold production | 1.30–1.40 million oz |
| Gold AISC | R1.30–1.395 million/kg |
| Underground recovered grade | Above 5.60g/t |
| Copper production | 28,000–30,000 tonnes |
| Copper C1 cash cost | US$2.55–2.65/lb |
| Copper yield | Approximately 3.50% |
The gold guidance implies lower production than FY26, while copper production is expected to increase substantially from the FY26 contribution of 18,207 tonnes.
That creates an interesting setup.
Gold remains the company’s core commodity, but copper is becoming more significant in the growth story. At the same time, FY27 gold AISC guidance is higher than the FY26 reported level.
Therefore, a trader assessing the harmony gold 2026 trading statement should monitor whether the market focuses more heavily on:
Higher copper growth + strong gold prices
or:
Lower gold production + higher expected costs
The stock reaction can depend on which narrative investors consider more important.
What traders should watch next
The harmony gold 2026 trading statement provides several variables worth tracking after the announcement.
1. Gold price
A major part of Harmony’s FY26 earnings strength came from the sharp increase in the gold price received. If gold prices weaken materially, the earnings environment could change even if production remains close to guidance.
2. AISC
AISC should be watched alongside gold prices rather than separately. A higher metal price can support margins, but increasing costs can reduce the benefit.
3. Copper execution
FY27 copper guidance of 28,000–30,000 tonnes makes copper an increasingly important part of the company’s operating profile.
4. Capital allocation
Harmony declared a final dividend of 750 South African cents per ordinary share, bringing total FY26 declared dividends to approximately R8.1 billion.
The balance between shareholder returns, project investment and debt management will remain relevant.
5. Market reaction versus fundamentals
A strong trading statement does not guarantee a rising stock price. Equity prices can move before, during or after results depending on expectations that were already reflected in the market.
That is why traders should compare the actual figures with what the market was expecting rather than looking only at whether the company’s results were “good.”
The official Harmony Gold investor page is the best place to monitor subsequent company announcements and financial disclosures.
FAQ
What did the harmony gold 2026 trading statement report?
The August 21, 2026 statement reported FY26 gold production of 1,429,551 ounces, gold AISC of US$2,195/oz, CSA copper production of 18,207 tonnes and sharply higher expected earnings compared with FY25.
Was Harmony Gold’s FY26 production higher or lower?
Gold production was lower year over year. Harmony produced 1,429,551 ounces in FY26 versus 1,479,671 ounces in FY25, a decline of approximately 3%.
Why did Harmony Gold earnings rise despite lower gold production?
The main factor was the much higher gold price received. Harmony’s average gold price received increased to US$3,811/oz from US$2,620/oz, while revenue rose 34% and final HEPS increased 87%.
What is Harmony Gold’s FY27 production guidance?
Harmony expects FY27 gold production of 1.30–1.40 million ounces and copper production of 28,000–30,000 tonnes. It also expects gold AISC of R1.30–1.395 million/kg.
Is Harmony Gold purely a gold company in 2026?
No. Gold remains central to the business, but Harmony has expanded its copper exposure, including the CSA mine in Australia and development work around the Eva Copper Project. The diversification is becoming an increasingly important part of its strategic outlook.
Risk Disclaimer
Trading and investing in mining shares involves risk, and past performance does not guarantee future results. Company earnings, commodity prices, currencies, production levels and market expectations can change. This article is for educational and informational purposes only and is not personalized financial advice.
Conclusion
The harmony gold 2026 trading statement showed a company entering FY27 with strong earnings and cash flow, despite a modest decline in gold production. The sharp increase in the gold price received was a major contributor to the improvement in profitability, while the CSA mine added a meaningful copper contribution.
The more important question going forward is whether Harmony can maintain strong cash generation while managing higher costs, lower expected gold production and increased exposure to copper.
For traders, the key takeaway is to avoid treating the announcement as a simple bullish or bearish signal. The harmony gold 2026 trading statement provides fundamental information, but the eventual share-price reaction depends on expectations, commodity prices, valuation and future guidance.