
Table of Contents
- What Is This Free Trading Indicator?
- What the Script Actually Includes
- 3 Smart Steps to Get the Free Trading Indicator
- Full Free Trading Indicator Script
- How to Use the Indicator on Your Chart
- What the Indicator Shows
- How to Test the Free Trading Indicator Properly
- Keep Risk Management Separate From the Indicator
- FAQs
- Risk Disclaimer
- Conclusion
The Free Trading Indicator from Shahzeb Trades is being provided as a practical charting tool for traders who want to explore the indicator without paying an upfront price for the script.
The important part is understanding what the indicator actually does before treating any signal, level, or dashboard value as part of a trading decision.
The script is written in Pine Script version 6 and is titled PREMIUM LEVEL | SHAHZEB TRADES in the source provided for this article. It is designed around support and resistance, retests, breaks, volume-based pressure calculations, zone strength, and a market-bias dashboard.
That makes this Free Trading Indicator more than a simple one-line signal tool. It contains several components intended to help organize chart information.
This article gives you the script, explains the main components, and shows how to add and test it on TradingView.
What Is This Free Trading Indicator?
The Free Trading Indicator is a TradingView Pine Script indicator that combines several charting functions into one script.
The core system identifies potential support and resistance levels using pivot highs and pivot lows. It then tracks information about those levels, including retests, breaks, volume, and a calculated strength score.
The script also calculates an approximate buying-versus-selling pressure percentage based on where the candle closes within its range. This is an approximation built into the code, not exchange-provided order-flow data.
Alongside the levels, the indicator includes a market-bias dashboard that evaluates:
- Overall bias
- 1H trend
- 15M trend
- Trending or sideways market condition
- Recent buying and selling pressure
The dashboard uses EMA relationships and ADX-based conditions.
So the Free Trading Indicator is best understood as a chart-analysis tool that brings several pieces of market information into one workspace.
What the Script Actually Includes
Before you install the Free Trading Indicator, it helps to understand its main features.
Support and Resistance Detection
The script uses pivot highs and pivot lows to identify support and resistance candidates.
It also avoids drawing levels that are too close together and manages a list of active support and resistance objects.
Zone Strength Calculation
The indicator calculates a strength score using three components:
- Touches or retests
- Average touch volume compared with average volume
- Level age or duration
The code weights these components at 45%, 30%, and 25% respectively.
Break and Retest Detection
The Free Trading Indicator can display break labels and retest labels. It also contains alert conditions for new breaks and retests.
Volume and Pressure Information
The script estimates buy and sell volume from the candle’s position within its high-low range. It also stores pressure information from retests and calculates recent pressure changes.
Live Intrabar Pressure
When price is interacting with an active level, the indicator can update a live pressure tag using the current candle information.
Market Bias Dashboard
The dashboard uses 20 EMA and 50 EMA relationships on the 1-hour and 15-minute timeframes to classify trend direction. It then combines those readings into an overall bias.
The script also uses ADX to classify the market as Trending or Sideways according to the configured threshold.
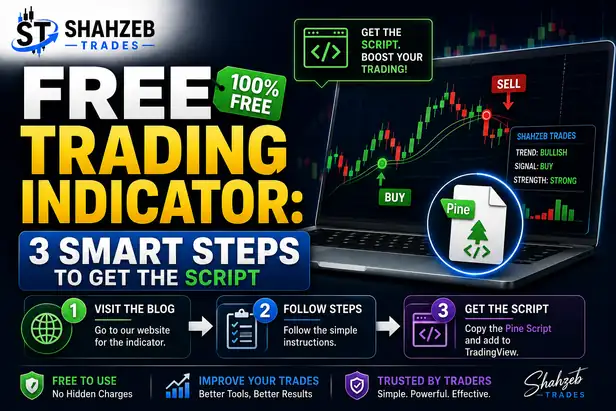
3 Smart Steps to Get the Free Trading Indicator
1. Understand the Indicator Before Using It
The first step with any Free Trading Indicator is understanding what you are actually adding to your chart.
This script contains multiple features, so avoid treating every label as a direct trade instruction.
Start with the main components:
Support and resistance:
The indicator identifies levels using pivot-based calculations.
Strength:
Each displayed level receives a calculated score based on touches, volume, and age.
Breaks and retests:
The script can mark when levels are broken and when price retests them.
Pressure:
The script provides estimated buying and selling pressure based on candle-range information.
Market bias:
The dashboard combines 1H and 15M EMA-based trend readings with an ADX market-condition reading.
A tool becomes much easier to evaluate when each output has a defined purpose.
Your Trading Tools workflow can be used to organize the indicator alongside your other charting tools.
2. Add the Script to TradingView
If you are using the source-code version, open TradingView and access the Pine Editor from the chart workspace.
Then:
- Open a new Pine Editor script.
- Remove any existing code.
- Paste the complete script from the section below.
- Save the script.
- Add it to the chart.
- Confirm that the indicator loads without compilation errors.
The script begins with //@version=6, so it is written for Pine Script version 6. The indicator declaration also specifies overlay = true, meaning its drawings are intended to appear directly on the price chart.
If TradingView reports a compilation issue after copying, check that the complete code was pasted without missing lines or altered characters.
3. Test the Free Trading Indicator Before Relying on It
The third step is the one that matters most.
Do not judge the Free Trading Indicator from one chart or a few recent signals.
Test it across different conditions.
Look at:
- Strong trends
- Sideways markets
- Pullbacks
- Breakouts
- Multiple timeframes
- Different symbols
- High-volatility periods
- Quiet market periods
The objective is to understand how the indicator behaves.
For example, a support level may receive multiple retests and accumulate a higher strength score. A resistance level may later be broken and become invalidated. The code also allows inverse levels to be created after breaks when that option is enabled.
That behavior should be studied before you build a trading routine around it.
Full Free Trading Indicator Script
The following is the complete Pine Script provided for this article.
// This Pine Script™ code is subject to the terms of the Mozilla Public License 2.0 at https://mozilla.org/MPL/2.0/
// PREMIUM LEVEL | SHAHZEB TRADES
//@version=6
//S&R V2.12
const bool DEBUG = false
const bool fixSRs = true
const bool fixRetests = false
indicator("PREMIUM LEVEL | SHAHZEB TRADES", overlay = true, max_labels_count = 500, max_lines_count = 500, max_boxes_count = 500, dynamic_requests = true)
const int maxSRInfoListSize = 10
const int maxBarInfoListSize = 3000
const int maxDistanceToLastBar = 500
const int minSRSize = 5
const int retestLabelCooldown = 3
const float tooCloseATR = 1.0 / 8.0
const int labelOffsetBars = 20
const int atrLen = 20
atr = ta.atr(atrLen)
avgVolume = ta.sma(volume, atrLen)
var int curTFMS = timeframe.in_seconds(timeframe.period) * 1000
var map<string, bool> alerts = map.new<string, bool>()
alerts.put("Retest", false)
alerts.put("Break", false)
srPivotLength = input.int(15, "Pivot Length", minval = 3, maxval = 50, group = "General Configuration", display = display.none)
srStrength = input.int(1, "Strength", [1, 2, 3], group = "General Configuration", display = display.none)
minStrengthToShow = input.float(25, "Minimum Strength % to Show Zone", minval = 0, maxval = 100, group = "General Configuration", tooltip = "Zones scoring below this % (touches + volume + age combined) will not be drawn. Raise this to reduce clutter and only see the strongest zones. Note: freshly-formed zones start with a low age score and need time/touches to climb — keep this low if zones aren't appearing.", display = display.none)
maxZonesToShow = input.int(6, "Max Zones to Show (0 = No Limit)", minval = 0, maxval = 50, group = "General Configuration", tooltip = "Caps how many S&R zones are drawn at once, starting with the most recently formed. Set to 0 for no limit.", display = display.none)
liveTouchToleranceMult = input.float(0.3, "Live Pressure Touch Sensitivity (x ATR)", minval = 0.05, maxval = 2.0, step = 0.05, group = "General Configuration", tooltip = "How close price needs to be to a zone for the LIVE buy/sell pressure tag to appear and update. Raise this if the live tag isn't showing up.", display = display.none)
srInvalidation = input.string("Close", "Invalidation", ["Wick", "Close"], group = "General Configuration", display = display.none)
expandZones = input.string("Only Valid", "Expand Lines & Zones", options = ["All", "Only Valid", "None"], group = "General Configuration", display = display.none)
showInvalidated = input.bool(true, "Show Invalidated", group = "General Configuration", display = display.none)
timeframe1Enabled = input.bool(true, title = "", group = "Timeframes", inline = "timeframe1", display = display.none)
timeframe1 = input.timeframe("", title = "", group = "Timeframes", inline = "timeframe1", display = display.none)
timeframe2Enabled = input.bool(false, title = "", group = "Timeframes", inline = "timeframe2", display = display.none)
timeframe2 = input.timeframe("D", title = "", group = "Timeframes", inline = "timeframe2", display = display.none)
timeframe3Enabled = input.bool(false, title = "", group = "Timeframes", inline = "timeframe3", display = display.none)
timeframe3 = input.timeframe("W", title = "", group = "Timeframes", inline = "timeframe3", display = display.none)
showBreaks = input.bool(true, "Show Breaks", group = "Breaks & Retests", inline = "ShowBR", display = display.none)
showRetests = input.bool(true, "Show Retests", group = "Breaks & Retests", inline = "ShowBR", display = display.none)
avoidFalseBreaks = input.bool(false, "Avoid False Breaks", group = "Breaks & Retests", display = display.none)
breakVolumeThreshold = input.float(0.3, "Break Volume Threshold", minval = 0.1, maxval = 2.0, step = 0.1, group = "Breaks & Retests", tooltip = "Only taken into account if Avoid False Breakouts is enabled.\nHigher values mean it's less likely to be a break.", display = display.none)
inverseBrokenLineColor = input.bool(false, "Inverse Color After Broken", group = "Breaks & Retests", display = display.none)
styleMode = input.string("Lines", "Style", ["Lines", "Zones"], group = "Style", display = display.none)
lineStyle = input.string("____", "Line Style", ["____", "----", "...."], group = "Style", display = display.none)
lineWidth = input.int(2, "Line Width", minval = 1, group = "Style", display = display.none)
zoneSize = input.float(1.0, "Zone Width", minval = 0.1, maxval = 10, step = 0.1, group = "Style", display = display.none)
zoneSizeATR = zoneSize * 0.075
supportColor = input.color(#08998180, "Support Color", group = "Style", inline = "RScolors", display = display.none)
resistanceColor = input.color(#f2364580, "Resistance Color", group = "Style", inline = "RScolors", display = display.none)
breakColor = input.color(color.blue, "Break Color", group = "Style", inline = "RScolors2", display = display.none)
textColor = input.color(#ffffff80, "Text Color", group = "Style", inline = "RScolors2", display = display.none)
enableRetestAlerts = input.bool(true, "Enable Retest Alerts", tooltip = "Needs Show Retests option enabled.", group = "Alerts", display = display.none)
enableBreakAlerts = input.bool(true, "Enable Break Alerts", tooltip = "Needs Show Breaks option enabled.", group = "Alerts", display = display.none)
// ============ MARKET BIAS DASHBOARD INPUTS ============
showBiasBox = input.bool(true, "Show Market Bias Box", group = "Market Bias Dashboard")
biasBoxPosition = input.string("Top Left", "Box Position", ["Top Left", "Middle Left", "Bottom Left"], group = "Market Bias Dashboard")
adxLength = input.int(14, "ADX Length (Trend Strength)", group = "Market Bias Dashboard")
adxThreshold = input.float(20, "ADX Trending Threshold", group = "Market Bias Dashboard")
pressureLookback = input.int(20, "Pressure Lookback Bars", group = "Market Bias Dashboard")
insideBounds = (bar_index > last_bar_index - maxDistanceToLastBar)
type srInfo
int startTime
float price
string srType
int strength
string timeframeStr
bool ephemeral = false
int breakTime
array<int> retestTimes
float formationVolume = na
float volumeSum = 0.0
float buyVolumeSum = 0.0
float sellVolumeSum = 0.0
array<float> retestBuyVols
array<float> retestSellVols
type srObj
srInfo info
bool startFixed
bool breakFixed
bool rendered
string combinedTimeframeStr
line srLine
box srBox
label srLabel
label breakLabel
array<label> retestLabels
string baseLabelText = na
type barInfo
int t
int tc
float c
float h
float l
float v
float buyVol
float sellVol
var allSRList = array.new<srObj>()
var bool needsRebuild = true
//#region Find Val RTN Time
findValRtnTime (barInfo[] biList, valToFind, toSearch, searchMode, minTime, maxTime, int defVal = na) =>
int rtnTime = defVal
float minDiff = na
if biList.size() > 0
for i = biList.size() - 1 to 0
curBI = biList.get(i)
if curBI.t >= minTime and curBI.t < maxTime
toLook = (toSearch == "Low" ? curBI.l : toSearch == "High" ? curBI.h : curBI.c)
if searchMode == "Nearest"
curDiff = math.abs(valToFind - toLook)
if na(minDiff)
rtnTime := curBI.t
minDiff := curDiff
else
if curDiff <= minDiff
minDiff := curDiff
rtnTime := curBI.t
if searchMode == "Higher"
if toLook >= valToFind
rtnTime := curBI.t
break
if searchMode == "Lower"
if toLook <= valToFind
rtnTime := curBI.t
break
rtnTime
//#endregion
formatTimeframeString (string formatTimeframe, bool short = false) =>
timeframeF = (formatTimeframe == "" ? timeframe.period : formatTimeframe)
if str.contains(timeframeF, "D") or str.contains(timeframeF, "W") or str.contains(timeframeF, "S") or str.contains(timeframeF, "M")
timeframe.from_seconds(timeframe.in_seconds(timeframeF))
else
seconds = timeframe.in_seconds(timeframeF)
if seconds >= 3600
hourCount = int(seconds / 3600)
if short
str.tostring(hourCount) + "h"
else
str.tostring(hourCount) + " Hour" + (hourCount > 1 ? "s" : "")
else
if short
timeframeF + "m"
else
timeframeF + " Min"
// ============ STRENGTH % CALCULATION ============
// Combines: touches/retests (45%), avg touch volume vs average volume (30%), level age/duration held (25%)
calcSRStrength (srInfo info) =>
touches = info.strength
touchFactor = math.min(touches / 5.0, 1.0) * 100
totalVol = nz(info.formationVolume) + info.volumeSum
avgTouchVol = touches > 0 ? totalVol / touches : nz(info.formationVolume)
volFactor = math.min(avgTouchVol / avgVolume, 2.0) / 2.0 * 100
endPoint = nz(info.breakTime, time)
ageBars = (endPoint - info.startTime) / curTFMS
ageFactor = math.min(ageBars / 50.0, 1.0) * 100
score = touchFactor * 0.45 + volFactor * 0.30 + ageFactor * 0.25
math.round(math.min(score, 100))
// Returns buyer percentage (0-100). Seller % = 100 - buyer %.
// Approximates buy/sell pressure from where price closed within each bar's range (close near high = buying pressure, close near low = selling pressure).
calcSRDelta (srInfo info) =>
totalDelta = info.buyVolumeSum + info.sellVolumeSum
buyPct = totalDelta > 0 ? (info.buyVolumeSum / totalDelta) * 100 : 50.0
math.round(buyPct)
// Buyer % using only the last N touches (recent trend, not full history)
calcSRRecentDelta (srInfo info, int n) =>
cnt = math.min(n, info.retestBuyVols.size())
recentBuy = 0.0
recentSell = 0.0
if cnt > 0
for i = 0 to cnt - 1
recentBuy += info.retestBuyVols.get(i)
recentSell += info.retestSellVols.get(i)
totalRecent = recentBuy + recentSell
totalRecent > 0 ? math.round((recentBuy / totalRecent) * 100) : na
// Compares recent pressure vs overall pressure to detect a shift (e.g. buyers fading, sellers taking over)
calcPressureShift (srInfo info) =>
overallBuy = calcSRDelta(info)
recentBuy = calcSRRecentDelta(info, 3)
string shiftTag = ""
if not na(recentBuy) and info.retestBuyVols.size() >= 2
diff = recentBuy - overallBuy
if diff >= 15
shiftTag := " | 🔴→🟢 Buyers Building"
else if diff <= -15
shiftTag := " | 🟢→🔴 Sellers Building"
else
shiftTag := " | ⚖ Stable"
shiftTag
// Formats raw volume numbers into readable K/M form (e.g. 12500 -> 12.5K)
formatVol (float v) =>
v >= 1000000 ? str.tostring(math.round(v / 100000) / 10) + "M" : v >= 1000 ? str.tostring(math.round(v / 100) / 10) + "K" : str.tostring(math.round(v))
renderSRObj (srObj sr) =>
if na(sr.info.breakTime) or showInvalidated
sr.rendered := true
endTime = nz(sr.info.breakTime, time + curTFMS * labelOffsetBars)
extendType = extend.none
if na(sr.info.breakTime)
extendType := extend.right
if expandZones == "Only Valid" and na(sr.info.breakTime)
extendType := extend.both
else if expandZones == "All"
extendType := extend.both
endTime := time + curTFMS * labelOffsetBars
labelTitle = formatTimeframeString(sr.info.timeframeStr)
if not na(sr.combinedTimeframeStr)
labelTitle := sr.combinedTimeframeStr
labelTitle += " | " + str.tostring(sr.info.price, format.mintick) + ((sr.info.ephemeral and DEBUG) ? " [E]" : "")
srStrengthScore = calcSRStrength(sr.info)
srStrengthTag = srStrengthScore >= 85 ? "EXTREME" : srStrengthScore >= 70 ? "STRONG" : srStrengthScore < 40 ? "WEAK" : "MEDIUM"
buyerPct = calcSRDelta(sr.info)
sellerPct = 100 - buyerPct
recentBuyPct = calcSRRecentDelta(sr.info, 3)
shiftTag = calcPressureShift(sr.info)
labelTitle += " | " + str.tostring(srStrengthScore) + "% " + srStrengthTag
labelTitle += " | 🟢" + str.tostring(buyerPct) + "% 🔴" + str.tostring(sellerPct) + "%"
labelTitle += " | Vol 🟢" + formatVol(sr.info.buyVolumeSum) + " 🔴" + formatVol(sr.info.sellVolumeSum)
if not na(recentBuyPct)
labelTitle += " | Last3 🟢" + str.tostring(recentBuyPct) + "% 🔴" + str.tostring(100 - recentBuyPct) + "%" + shiftTag
if styleMode == "Lines"
// Line
sr.srLine := line.new(sr.info.startTime, sr.info.price, endTime, sr.info.price, xloc = xloc.bar_time, color = sr.info.srType == "Resistance" ? resistanceColor : supportColor, width = lineWidth, style = lineStyle == "----" ? line.style_dashed : lineStyle == "...." ? line.style_dotted : line.style_solid, extend = extendType)
// Label
sr.srLabel := label.new(extendType == extend.none ? ((sr.info.startTime + endTime) / 2) : endTime, sr.info.price, xloc = xloc.bar_time, text = labelTitle, textcolor = textColor, style = label.style_none)
sr.baseLabelText := labelTitle
else
// Zone
sr.srBox := box.new(sr.info.startTime, sr.info.price + atr * zoneSizeATR, endTime, sr.info.price - atr * zoneSizeATR, xloc = xloc.bar_time, bgcolor = sr.info.srType == "Resistance" ? resistanceColor : supportColor, border_color = na, text = labelTitle, text_color = textColor, extend = extendType, text_size = size.normal, text_halign = (extendType != extend.none) ? text.align_right : text.align_center)
sr.baseLabelText := labelTitle
// Break Label
if showBreaks
if not na(sr.info.breakTime)
sr.breakLabel := label.new(sr.info.breakTime, sr.info.price, "B", yloc = sr.info.srType == "Resistance" ? yloc.belowbar : yloc.abovebar, style = sr.info.srType == "Resistance" ? label.style_label_up : label.style_label_down, color = breakColor, textcolor = color.new(textColor, 0), xloc = xloc.bar_time, size = size.small)
if (time - curTFMS <= sr.info.breakTime) and (time + curTFMS >= sr.info.breakTime)
alerts.put("Break", true)
// Retest Labels
if showRetests
if sr.info.retestTimes.size() > 0
for i = sr.info.retestTimes.size() - 1 to 0
curRetestTime = sr.info.retestTimes.get(i)
cooldownOK = true
if sr.retestLabels.size() > 0
lastLabel = sr.retestLabels.get(0)
if math.abs(lastLabel.get_x() - curRetestTime) < curTFMS * retestLabelCooldown
cooldownOK := false
if cooldownOK and (curRetestTime >= sr.info.startTime) and (na(sr.info.breakTime) or curRetestTime < sr.info.breakTime)
if time - curTFMS <= curRetestTime and time >= curRetestTime
alerts.put("Retest", true)
sr.retestLabels.unshift(label.new(curRetestTime, sr.info.price, "R" + (DEBUG ? (" " + str.tostring(sr.info.price)) : ""), yloc = sr.info.srType == "Resistance" ? yloc.abovebar : yloc.belowbar, style = sr.info.srType == "Resistance" ? label.style_label_down : label.style_label_up, color = sr.info.srType == "Resistance" ? resistanceColor : supportColor, textcolor = color.new(textColor, 0), xloc = xloc.bar_time, size = size.small))
safeDeleteSRObj (srObj sr) =>
if sr.rendered
line.delete(sr.srLine)
box.delete(sr.srBox)
label.delete(sr.srLabel)
label.delete(sr.breakLabel)
if sr.retestLabels.size() > 0
for i = 0 to sr.retestLabels.size() - 1
curRetestLabel = sr.retestLabels.get(i)
label.delete(curRetestLabel)
sr.rendered := false
var allSRInfoList = array.new<srInfo>()
var barInfoList = array.new<barInfo>()
pivotHigh = ta.pivothigh(srPivotLength, srPivotLength)
pivotLow = ta.pivotlow(srPivotLength, srPivotLength)
curBarRange = high - low
curBuyVol = curBarRange != 0 ? volume * (close - low) / curBarRange : volume * 0.5
curSellVol = curBarRange != 0 ? volume * (high - close) / curBarRange : volume * 0.5
barInfoList.unshift(barInfo.new(time, time_close, close, high, low, volume, curBuyVol, curSellVol))
if barInfoList.size() > maxBarInfoListSize
barInfoList.pop()
if insideBounds and barstate.isconfirmed
// Find Supports
if not na(pivotLow)
validSR = true
if allSRInfoList.size() > 0
for i = 0 to allSRInfoList.size() - 1
curRSInfo = allSRInfoList.get(i)
if (math.abs(curRSInfo.price - pivotLow) < atr * tooCloseATR) and na(curRSInfo.breakTime)
validSR := false
break
if validSR
newSRInfo = srInfo.new(barInfoList.get(srPivotLength).t, pivotLow, "Support", 1, timeframe.period)
newSRInfo.retestTimes := array.new<int>()
newSRInfo.retestBuyVols := array.new<float>()
newSRInfo.retestSellVols := array.new<float>()
newSRInfo.formationVolume := barInfoList.get(srPivotLength).v
newSRInfo.buyVolumeSum := barInfoList.get(srPivotLength).buyVol
newSRInfo.sellVolumeSum := barInfoList.get(srPivotLength).sellVol
allSRInfoList.unshift(newSRInfo)
while allSRInfoList.size() > maxSRInfoListSize
allSRInfoList.pop()
needsRebuild := true
// Find Resistances
if not na(pivotHigh)
validSR = true
if allSRInfoList.size() > 0
for i = 0 to allSRInfoList.size() - 1
curRSInfo = allSRInfoList.get(i)
if (math.abs(curRSInfo.price - pivotLow) < atr * tooCloseATR) and na(curRSInfo.breakTime)
validSR := false
break
if validSR
newSRInfo = srInfo.new(barInfoList.get(srPivotLength).t, pivotHigh, "Resistance", 1, timeframe.period)
newSRInfo.retestTimes := array.new<int>()
newSRInfo.retestBuyVols := array.new<float>()
newSRInfo.retestSellVols := array.new<float>()
newSRInfo.formationVolume := barInfoList.get(srPivotLength).v
newSRInfo.buyVolumeSum := barInfoList.get(srPivotLength).buyVol
newSRInfo.sellVolumeSum := barInfoList.get(srPivotLength).sellVol
allSRInfoList.unshift(newSRInfo)
if allSRInfoList.size() > maxSRInfoListSize
allSRInfoList.pop()
needsRebuild := true
// Handle SR Infos
if insideBounds and (srInvalidation == "Wick" or barstate.isconfirmed)
if allSRInfoList.size() > 0
for i = 0 to allSRInfoList.size() - 1
srInfo curSRInfo = allSRInfoList.get(i)
// Breaks
invHigh = (srInvalidation == "Close" ? close : high)
invLow = (srInvalidation == "Close" ? close : low)
closeTime = time
if na(curSRInfo.breakTime)
if curSRInfo.srType == "Resistance" and invHigh > curSRInfo.price
if (not avoidFalseBreaks) or (volume > avgVolume * breakVolumeThreshold)
curSRInfo.breakTime := closeTime
needsRebuild := true
if inverseBrokenLineColor and (not curSRInfo.ephemeral) and curSRInfo.strength >= srStrength
ephSR = srInfo.new(closeTime, curSRInfo.price, "Support", curSRInfo.strength, curSRInfo.timeframeStr, true)
ephSR.retestTimes := array.new<int>()
ephSR.retestBuyVols := array.new<float>()
ephSR.retestSellVols := array.new<float>()
allSRInfoList.unshift(ephSR)
else if curSRInfo.srType == "Support" and invLow < curSRInfo.price
if (not avoidFalseBreaks) or (volume > avgVolume * breakVolumeThreshold)
curSRInfo.breakTime := closeTime
needsRebuild := true
if inverseBrokenLineColor and (not curSRInfo.ephemeral) and curSRInfo.strength >= srStrength
ephSR = srInfo.new(closeTime, curSRInfo.price, "Resistance", curSRInfo.strength, curSRInfo.timeframeStr, true)
ephSR.retestTimes := array.new<int>()
ephSR.retestBuyVols := array.new<float>()
ephSR.retestSellVols := array.new<float>()
allSRInfoList.unshift(ephSR)
// Strength & Retests
curBarRangeR = high - low
curBuyVolR = curBarRangeR != 0 ? volume * (close - low) / curBarRangeR : volume * 0.5
curSellVolR = curBarRangeR != 0 ? volume * (high - close) / curBarRangeR : volume * 0.5
if na(curSRInfo.breakTime) and time > curSRInfo.startTime and barstate.isconfirmed
if curSRInfo.srType == "Resistance" and high >= curSRInfo.price and close <= curSRInfo.price
int lastRetestTime = 0
if curSRInfo.retestTimes.size() > 0
lastRetestTime := curSRInfo.retestTimes.get(0)
if lastRetestTime != time
if not curSRInfo.ephemeral
curSRInfo.strength += 1
curSRInfo.volumeSum += volume
curSRInfo.buyVolumeSum += curBuyVolR
curSRInfo.sellVolumeSum += curSellVolR
curSRInfo.retestBuyVols.unshift(curBuyVolR)
curSRInfo.retestSellVols.unshift(curSellVolR)
needsRebuild := true
curSRInfo.retestTimes.unshift(time)
else if curSRInfo.srType == "Support" and low <= curSRInfo.price and close >= curSRInfo.price
int lastRetestTime = 0
if curSRInfo.retestTimes.size() > 0
lastRetestTime := curSRInfo.retestTimes.get(0)
if lastRetestTime != time
if not curSRInfo.ephemeral
curSRInfo.strength += 1
curSRInfo.volumeSum += volume
curSRInfo.buyVolumeSum += curBuyVolR
curSRInfo.sellVolumeSum += curSellVolR
curSRInfo.retestBuyVols.unshift(curBuyVolR)
curSRInfo.retestSellVols.unshift(curSellVolR)
needsRebuild := true
curSRInfo.retestTimes.unshift(time)
fixSRToTimeframe (srObj sr) =>
srMS = math.max(timeframe.in_seconds(sr.info.timeframeStr), timeframe.in_seconds()) * 1000
if (not sr.startFixed)
if not sr.info.ephemeral
if sr.info.srType == "Resistance"
sr.info.startTime := findValRtnTime(barInfoList, sr.info.price, "High", "Nearest", sr.info.startTime - srMS, sr.info.startTime + srMS, sr.info.startTime)
else
sr.info.startTime := findValRtnTime(barInfoList, sr.info.price, "Low", "Nearest", sr.info.startTime - srMS, sr.info.startTime + srMS, sr.info.startTime)
sr.startFixed := true
else
if allSRList.size() > 0
for i = 0 to allSRList.size() - 1
curSR = allSRList.get(i)
if (not curSR.info.ephemeral) and (not na(curSR.info.breakTime)) and curSR.info.price == sr.info.price and ((sr.info.srType == "Resistance" and curSR.info.srType == "Support") or (sr.info.srType == "Support" and curSR.info.srType == "Resistance"))
if curSR.breakFixed
sr.info.startTime := curSR.info.breakTime
sr.startFixed := true
break
if not na(sr.info.breakTime)
if (not sr.breakFixed)
if sr.info.srType == "Resistance"
sr.info.breakTime := findValRtnTime(barInfoList, sr.info.price, srInvalidation == "Wick" ? "High" : "Close", "Higher", sr.info.breakTime - srMS, sr.info.breakTime + srMS, sr.info.breakTime)
else
sr.info.breakTime := findValRtnTime(barInfoList, sr.info.price, srInvalidation == "Wick" ? "Low" : "Close", "Lower", sr.info.breakTime - srMS, sr.info.breakTime + srMS, sr.info.breakTime)
sr.breakFixed := true
if sr.info.retestTimes.size() > 0 and fixRetests
for i = 0 to sr.info.retestTimes.size() - 1
curRetestTime = sr.info.retestTimes.get(i)
retestStartTime = curRetestTime - srMS
retestStartTime := math.max(retestStartTime, sr.info.startTime + 1)
retestEndTime = curRetestTime + srMS
if not na(sr.info.breakTime)
retestEndTime := math.min(retestEndTime, sr.info.breakTime - 1)
if sr.info.srType == "Resistance"
sr.info.retestTimes.set(i, findValRtnTime(barInfoList, sr.info.price, "High", "Higher", retestStartTime, retestEndTime, sr.info.retestTimes.get(i)))
else
sr.info.retestTimes.set(i, findValRtnTime(barInfoList, sr.info.price, "Low", "Lower", retestStartTime, retestEndTime, sr.info.retestTimes.get(i)))
getSR (srObj[] list, srPrice, eph, srType, timeframeStr) =>
srObj rtnSR = na
if list.size() > 0
for i = 0 to list.size() - 1
curSR = list.get(i)
if curSR.info.price == srPrice and curSR.info.ephemeral == eph and curSR.info.srType == srType and curSR.info.timeframeStr == timeframeStr
rtnSR := curSR
break
rtnSR
// Handle SR
handleTF (tfStr, tfEnabled) =>
if tfEnabled
// FIX (delayed-zone bug): when the requested timeframe is the chart's own timeframe,
// read allSRInfoList directly instead of round-tripping it through request.security().
// request.security() on the same timeframe re-enters its own execution context and can
// lag the render list a bar behind the detection list — that lag is exactly why zones
// were only appearing after price had already touched and moved away from the level.
// This changes nothing about what is detected or how it's drawn — only removes the
// unnecessary, lag-inducing round-trip for the same-timeframe case. Other/higher
// timeframes still go through request.security() exactly as before.
tfSRInfoList = (tfStr == "" or tfStr == timeframe.period) ? allSRInfoList : request.security(syminfo.tickerid, tfStr, allSRInfoList)
if not na(tfSRInfoList) and tfSRInfoList.size() > 0
for i = 0 to tfSRInfoList.size() - 1
srInfo curSRInfo = tfSRInfoList.get(i)
if fixSRs
currentSameSR = getSR(allSRList, curSRInfo.price, curSRInfo.ephemeral, curSRInfo.srType, curSRInfo.timeframeStr)
if not na(currentSameSR)
if currentSameSR.startFixed
curSRInfo.startTime := currentSameSR.info.startTime
if currentSameSR.breakFixed
curSRInfo.breakTime := currentSameSR.info.breakTime
curSRInfo.retestTimes := currentSameSR.info.retestTimes
curSRInfo.retestBuyVols := currentSameSR.info.retestBuyVols
curSRInfo.retestSellVols := currentSameSR.info.retestSellVols
// All other info should be replaced except fixed start, break and all retests.
currentSameSR.info := curSRInfo
if not currentSameSR.breakFixed
fixSRToTimeframe(currentSameSR)
else
srObj newSRObj = srObj.new(curSRInfo)
// We handle retests in current timeframe so no need to get them from upper.
newSRObj.info.retestTimes := array.new<int>()
newSRObj.info.retestBuyVols := array.new<float>()
newSRObj.info.retestSellVols := array.new<float>()
newSRObj.retestLabels := array.new<label>()
fixSRToTimeframe(newSRObj)
allSRList.unshift(newSRObj)
else
srObj newSRObj = srObj.new(curSRInfo)
newSRObj.retestLabels := array.new<label>()
allSRList.unshift(newSRObj)
true
if (bar_index > last_bar_index - maxDistanceToLastBar * 8) and barstate.isconfirmed and (needsRebuild or barstate.islast)
if not fixSRs
if allSRList.size() > 0
for i = 0 to allSRList.size() - 1
srObj curSRObj = allSRList.get(i)
safeDeleteSRObj(curSRObj)
allSRList.clear()
handleTF(timeframe1, timeframe1Enabled)
handleTF(timeframe2, timeframe2Enabled)
handleTF(timeframe3, timeframe3Enabled)
if allSRList.size() > 0
// Capture which zones were already showing BEFORE we clear drawings (for sticky priority)
var array<bool> wasShown = array.new<bool>()
array.clear(wasShown)
for i = 0 to allSRList.size() - 1
array.push(wasShown, allSRList.get(i).rendered)
// Pass 1: clear ALL existing drawings first so nothing stale lingers
for i = 0 to allSRList.size() - 1
safeDeleteSRObj(allSRList.get(i))
// Build a render order: zones that were ALREADY showing (and are still active/unbroken) keep
// their slot first (sticky, prevents flicker from being bumped by a newer stronger zone).
// Remaining slots are filled by strength, strongest first.
var array<int> renderOrder = array.new<int>()
array.clear(renderOrder)
var array<bool> usedIdx = array.new<bool>()
array.clear(usedIdx)
for i = 0 to allSRList.size() - 1
array.push(usedIdx, false)
for i = 0 to allSRList.size() - 1
if array.get(wasShown, i) and na(allSRList.get(i).info.breakTime)
array.push(renderOrder, i)
array.set(usedIdx, i, true)
for k = 0 to allSRList.size() - 1
bestIdx = -1
bestScore = -1.0
for i = 0 to allSRList.size() - 1
if not array.get(usedIdx, i)
sc = calcSRStrength(allSRList.get(i).info)
if sc > bestScore
bestScore := sc
bestIdx := i
if bestIdx != -1
array.push(renderOrder, bestIdx)
array.set(usedIdx, bestIdx, true)
// Pass 2: render in the order above (same tooClose logic as before), stop once cap is hit
renderedCount = 0
for k = 0 to renderOrder.size() - 1
idx = array.get(renderOrder, k)
srObj curSRObj = allSRList.get(idx)
tooClose = false
for j = 0 to allSRList.size() - 1
closeSR = allSRList.get(j)
if closeSR.rendered and math.abs(closeSR.info.price - curSRObj.info.price) <= tooCloseATR * atr and closeSR.info.srType == curSRObj.info.srType and closeSR.info.ephemeral == curSRObj.info.ephemeral
tooClose := true
if not str.contains((na(closeSR.combinedTimeframeStr) ? formatTimeframeString(closeSR.info.timeframeStr) : closeSR.combinedTimeframeStr), formatTimeframeString(curSRObj.info.timeframeStr))
if na(closeSR.combinedTimeframeStr)
closeSR.combinedTimeframeStr := formatTimeframeString(closeSR.info.timeframeStr) + " & " + formatTimeframeString(curSRObj.info.timeframeStr)
else
closeSR.combinedTimeframeStr += " & " + formatTimeframeString(curSRObj.info.timeframeStr)
break
if (curSRObj.info.strength >= srStrength) and (na(curSRObj.info.breakTime) or (curSRObj.info.breakTime - curSRObj.info.startTime) >= minSRSize * curTFMS) and (not tooClose) and (calcSRStrength(curSRObj.info) >= minStrengthToShow)
renderSRObj(curSRObj)
renderedCount += 1
if maxZonesToShow > 0 and renderedCount >= maxZonesToShow
break
needsRebuild := false
// Current Timeframe Retests
if allSRList.size() > 0 and barstate.isconfirmed
for i = 0 to allSRList.size() - 1
srObj curSR = allSRList.get(i)
if na(curSR.info.breakTime) and time > curSR.info.startTime
if curSR.info.srType == "Resistance" and high >= curSR.info.price and close <= curSR.info.price
int lastRetestTime = 0
if curSR.info.retestTimes.size() > 0
lastRetestTime := curSR.info.retestTimes.get(0)
if lastRetestTime != time
curSR.info.retestTimes.unshift(time)
else if curSR.info.srType == "Support" and low <= curSR.info.price and close >= curSR.info.price
int lastRetestTime = 0
if curSR.info.retestTimes.size() > 0
lastRetestTime := curSR.info.retestTimes.get(0)
if lastRetestTime != time
curSR.info.retestTimes.unshift(time)
// ============ LIVE INTRABAR PRESSURE (updates every tick, not just on candle close) ============
// Only touches zones price is currently sitting at, so this stays cheap even on unconfirmed/realtime ticks.
if allSRList.size() > 0
liveBarRange = high - low
liveBuyVol = liveBarRange != 0 ? volume * (close - low) / liveBarRange : volume * 0.5
liveSellVol = liveBarRange != 0 ? volume * (high - close) / liveBarRange : volume * 0.5
liveTotalVol = liveBuyVol + liveSellVol
liveBuyPct = liveTotalVol > 0 ? math.round(liveBuyVol / liveTotalVol * 100) : 50
liveSellPct = 100 - liveBuyPct
liveTouchTolerance = atr * liveTouchToleranceMult
for i = 0 to allSRList.size() - 1
liveSR = allSRList.get(i)
if liveSR.rendered and na(liveSR.info.breakTime) and not na(liveSR.baseLabelText)
isTouching = math.abs(close - liveSR.info.price) <= liveTouchTolerance or (low - liveTouchTolerance <= liveSR.info.price and high + liveTouchTolerance >= liveSR.info.price)
if isTouching
liveTag = " | LIVE 🟢" + str.tostring(liveBuyPct) + "% 🔴" + str.tostring(liveSellPct) + "%"
if styleMode == "Lines" and not na(liveSR.srLabel)
label.set_text(liveSR.srLabel, liveSR.baseLabelText + liveTag)
else if styleMode == "Zones" and not na(liveSR.srBox)
box.set_text(liveSR.srBox, liveSR.baseLabelText + liveTag)
// ============ MARKET BIAS DASHBOARD LOGIC ============
getTrend(simple string tf) =>
[ema20, ema50, curClose] = request.security(syminfo.tickerid, tf, [ta.ema(close, 20), ta.ema(close, 50), close], lookahead = barmerge.lookahead_off)
string trend = "Neutral"
if curClose > ema20 and ema20 > ema50
trend := "Bullish"
else if curClose < ema20 and ema20 < ema50
trend := "Bearish"
trend
getOverallBias(t1h, t15m) =>
string bias = "Neutral"
if t1h == "Bullish" and t15m == "Bullish"
bias := "Strong Bullish"
else if t1h == "Bearish" and t15m == "Bearish"
bias := "Strong Bearish"
else if t1h == "Bullish" or t15m == "Bullish"
bias := "Mild Bullish"
else if t1h == "Bearish" or t15m == "Bearish"
bias := "Mild Bearish"
bias
getTrendColor(t) =>
t == "Bullish" ? color.new(color.green, 0) : t == "Bearish" ? color.new(color.red, 0) : color.new(color.gray, 0)
getBiasColor(b) =>
b == "Strong Bullish" ? color.new(color.green, 0) : b == "Mild Bullish" ? color.new(color.lime, 20) : b == "Strong Bearish" ? color.new(color.red, 0) : b == "Mild Bearish" ? color.new(color.orange, 20) : color.new(color.gray, 0)
// Trend on 1H and 15M
trend1H = getTrend("60")
trend15M = getTrend("15")
overallBias = getOverallBias(trend1H, trend15M)
// Market condition (Trending vs Sideways) via ADX on current chart timeframe
[diPlus, diMinus, adxVal] = ta.dmi(adxLength, adxLength)
marketCondition = adxVal >= adxThreshold ? "Trending" : "Sideways"
// Buy/Sell pressure using approximate volume from recent bars
var float pressureBuySum = 0.0
var float pressureSellSum = 0.0
if barInfoList.size() >= pressureLookback
pressureBuySum := 0.0
pressureSellSum := 0.0
for i = 0 to pressureLookback - 1
bi = barInfoList.get(i)
pressureBuySum += bi.buyVol
pressureSellSum += bi.sellVol
totalPressureVol = pressureBuySum + pressureSellSum
buyPressurePct = totalPressureVol > 0 ? math.round((pressureBuySum / totalPressureVol) * 100) : 50
sellPressurePct = 100 - buyPressurePct
var table biasTable = table.new(biasBoxPosition == "Top Left" ? position.top_left : biasBoxPosition == "Middle Left" ? position.middle_left : position.bottom_left, 2, 6, border_width = 1, border_color = color.new(color.gray, 50), frame_color = color.new(color.gray, 30), frame_width = 1)
if showBiasBox and barstate.islast
table.cell(biasTable, 0, 0, "MARKET BIAS", text_color = color.white, bgcolor = color.new(color.blue, 60), text_size = size.small, text_halign = text.align_center)
table.merge_cells(biasTable, 0, 0, 1, 0)
table.cell(biasTable, 0, 1, "Overall Bias", text_color = color.white, bgcolor = color.new(color.black, 70), text_size = size.small)
table.cell(biasTable, 1, 1, overallBias, text_color = getBiasColor(overallBias), bgcolor = color.new(color.black, 70), text_size = size.small, text_halign = text.align_right)
table.cell(biasTable, 0, 2, "1H Trend", text_color = color.white, bgcolor = color.new(color.black, 70), text_size = size.small)
table.cell(biasTable, 1, 2, trend1H, text_color = getTrendColor(trend1H), bgcolor = color.new(color.black, 70), text_size = size.small, text_halign = text.align_right)
table.cell(biasTable, 0, 3, "15M Trend", text_color = color.white, bgcolor = color.new(color.black, 70), text_size = size.small)
table.cell(biasTable, 1, 3, trend15M, text_color = getTrendColor(trend15M), bgcolor = color.new(color.black, 70), text_size = size.small, text_halign = text.align_right)
table.cell(biasTable, 0, 4, "Market Condition", text_color = color.white, bgcolor = color.new(color.black, 70), text_size = size.small)
table.cell(biasTable, 1, 4, marketCondition, text_color = marketCondition == "Trending" ? color.new(color.yellow, 0) : color.new(color.gray, 0), bgcolor = color.new(color.black, 70), text_size = size.small, text_halign = text.align_right)
table.cell(biasTable, 0, 5, "Pressure", text_color = color.white, bgcolor = color.new(color.black, 70), text_size = size.small)
table.cell(biasTable, 1, 5, str.tostring(buyPressurePct) + "%🟢 / " + str.tostring(sellPressurePct) + "%🔴", text_color = buyPressurePct > sellPressurePct ? color.new(color.green, 0) : color.new(color.red, 0), bgcolor = color.new(color.black, 70), text_size = size.small, text_halign = text.align_right)
//plotchar(alerts.get("Break") ? high : na, "", "✅", size = size.normal)
//plotchar(alerts.get("Retest") ? high : na, "", "❤️", size = size.normal, location = location.belowbar)
alertcondition(alerts.get("Retest"), "New Retest", "")
alertcondition(alerts.get("Break"), "New Break", "")
if enableRetestAlerts and alerts.get("Retest")
alert("New Retests Occured.")
if enableBreakAlerts and alerts.get("Break")
alert("New Breaks Occured.")
How to Use the Indicator on Your Chart
Once the Free Trading Indicator is added successfully, avoid turning on every possible setting immediately.
Start with the default configuration.
The source code includes configuration areas for:
- General Configuration
- Timeframes
- Breaks & Retests
- Style
- Alerts
- Market Bias Dashboard
The default settings include a pivot length of 15, a minimum strength threshold of 25%, a maximum of six displayed zones, break and retest display enabled, and the market-bias dashboard enabled.
Change one setting at a time.
That makes it easier to understand what each adjustment actually changes on the chart.
What the Indicator Shows
The Free Trading Indicator can display support and resistance information directly on the price chart.
A displayed level can include:
- Timeframe
- Price
- Strength score
- Strength label
- Estimated buyer percentage
- Estimated seller percentage
- Buy and sell volume estimates
- Recent pressure information
The script formats this information into the level label when the object is rendered.
The market-bias dashboard adds another layer of information.
It can show:
Overall Bias
Strong Bullish, Strong Bearish, Mild Bullish, Mild Bearish, or Neutral.
1H Trend
Bullish, Bearish, or Neutral.
15M Trend
Bullish, Bearish, or Neutral.
Market Condition
Trending or Sideways.
Pressure
Estimated recent buy versus sell pressure.
This information is generated by the script’s own calculations and should be interpreted as part of a broader analysis process.
How to Test the Free Trading Indicator Properly
Testing the Free Trading Indicator should be structured rather than random.
Test 1: Trend Conditions
Look at charts where price has a clear directional movement.
Check whether support and resistance levels help organize the structure.
Test 2: Sideways Conditions
Examine ranges and less directional environments.
This is useful because an indicator may behave differently when price repeatedly interacts with nearby levels.
Test 3: Break and Retest Behavior
Review levels that are broken and later tested again.
Check whether the break and retest labels correspond to the conditions you expect from the code.
Test 4: Multi-Timeframe Behavior
The script can process multiple timeframes, with the second and third timeframe inputs disabled by default.
Test them one at a time rather than changing several settings together.
Test 5: Pressure Readings
Remember that the script explicitly describes its pressure calculation as an approximation based on where the candle closes within its range.
That means the pressure percentage should not automatically be interpreted as institutional order-flow or exchange-level bid/ask volume.
The purpose of testing is to understand the tool, not to force the chart to confirm an existing opinion.
Keep Risk Management Separate From the Indicator
A Free Trading Indicator should support analysis, not determine how much capital you expose.
Your risk management process should define position size, stop placement, maximum risk, and when you stop trading.
The indicator can highlight a level.
It cannot know your account size.
It cannot know how much loss you can financially tolerate.
And its output does not remove the uncertainty of the market.
That separation is important.
Use the Free Trading Indicator to organize information, then use your own trading plan to decide whether a trade is appropriate.
FAQs
Is the Free Trading Indicator actually free?
Yes. The script described in this article is being provided without an upfront charge. Free access refers to the cost of accessing the script; it does not imply a particular trading result.
How do I install the Free Trading Indicator in TradingView?
Open TradingView’s Pine Editor, create a new script, remove the existing code, paste the complete Pine Script shown in this article, save it, and add it to the chart. The script uses Pine Script version 6.
What does the Free Trading Indicator show?
It can show pivot-based support and resistance levels, strength information, break and retest labels, estimated pressure and volume information, and a market-bias dashboard. The exact display depends on the script settings and market data available on the chart.
Can I use the Free Trading Indicator on every timeframe?
The script contains timeframe inputs and can process multiple timeframes. However, you should test it on the timeframe and market you actually trade rather than assuming that identical behavior will occur everywhere.
Does the Free Trading Indicator give automatic buy and sell signals?
Not in the simple sense of a guaranteed entry system. The code is primarily focused on levels, breaks, retests, estimated pressure, and market-bias information. Those outputs can be used as part of analysis, but they do not determine a particular future market outcome.
Should I trust the pressure percentage as real order flow?
No. The script itself describes the buy/sell pressure calculation as an approximation based on candle position within its range. It should not automatically be treated as exchange-level order-flow or true bid/ask delta data.
Risk Disclaimer
Trading financial markets involves substantial risk. A Free Trading Indicator is a technical analysis tool and cannot remove market risk or guarantee a particular result. This article is for educational purposes only and is not personal financial advice. Test the script before relying on it, understand your platform and broker conditions, use appropriate risk management, and trade only with capital you can afford to lose.
Conclusion
The Free Trading Indicator is designed to bring several charting components into one TradingView script.
You can use it to study:
- Support and resistance
- Level strength
- Breaks
- Retests
- Estimated pressure
- Multi-timeframe trend
- Market condition
- Alerts
The three-step process is straightforward:
Understand the script.
Add it correctly.
Test it before relying on it.
The biggest mistake would be to install the Free Trading Indicator and immediately treat every level or dashboard reading as a trade instruction.
Use the script as a tool inside a broader process.
Keep your risk plan separate.
Test its behavior on your own charts.
And judge the indicator by how useful it is to your analysis rather than by assumptions about what it should do.