
Last Updated: September 30, 2026
Table of Contents
Introduction
Price Action Forex starts with one question: what is price doing right now?
Instead of waiting for several indicators to agree, you study candles, swing points, key levels, and how price reacts around them. OANDA’s current guide describes price action as decisions based on raw price movement, including candlesticks, support and resistance, trend lines, and chart formations.
The goal isn’t to predict every candle. It’s to build a repeatable way to read a chart.
What Price Action Forex Means
Price Action Forex means studying market movement directly from the chart. A candle gives four useful pieces of information: open, high, low, and close.
A long bullish candle can show strong buying, while long wicks may show rejection or hesitation.
Don’t trade a candle in isolation. Location matters.
TradingView’s current candlestick guidance explains that patterns can suggest reversal, continuation, or uncertainty, but their position on the chart matters.
Read Candlesticks and Structure
Start with candle anatomy, then learn a few patterns.
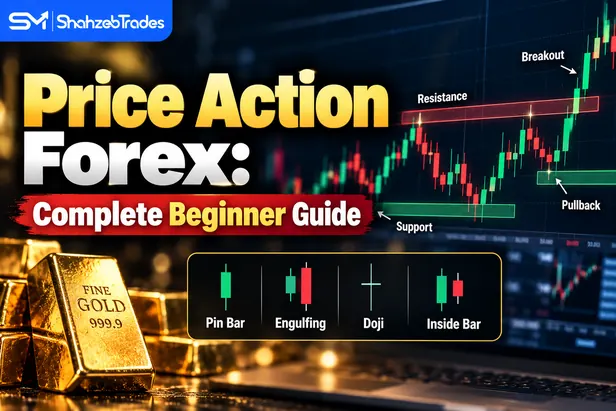
An engulfing candle can show a shift in short-term pressure. A pin bar highlights rejection through its wick. An inside bar shows a smaller range contained inside the previous candle.
Now add structure. An uptrend generally prints higher highs and higher lows. A downtrend shows lower highs and lower lows. When that sequence changes, the chart deserves a fresh look.
Mark the most obvious swing highs and lows first. Ignore tiny fluctuations that only appear after heavy zooming.
For Price Action Forex, ask whether the candle confirms the structure or fights it. A bullish candle inside a clear downtrend is not the same setup as a bullish rejection at a well-tested low.
Mark Support and Resistance
Support and resistance are better treated as areas than razor-thin lines.
Look for places where price repeatedly paused, rejected, or broke and later reacted again. A level with several clean reactions can deserve more attention than a random line drawn from one wick.
Don’t ask, “Will this level hold?” Ask, “What will price do here?”
A rejection can show failed continuation. A clean break can show acceptance beyond the level. A quick break followed by a return may create a failed breakout.
Build a Simple Setup
Don’t collect ten patterns. Pick one setup you can describe before the trade.
Example:
- Higher timeframe structure is bullish.
- Price pulls back into previous support.
- The bearish push weakens.
- A bullish rejection or engulfing candle closes.
- The stop goes below the structural invalidation point.
That is a process, not a prediction.
You can reverse the logic for a bearish setup. The important part is that every condition can be checked later in your journal.
Multiple timeframe analysis can help. For example, use 1H for broad structure, 15M for the setup, and 5M for entry refinement.
Manage Risk and Practice
A clean chart still needs money management.
Suppose your account is $2,000 and you choose a 0.5% risk limit. Your planned loss is $10.
If the technical stop is wider than expected, reduce position size. Don’t drag the stop closer just to make the trade fit.
Risk Amount = Account Equity × Risk Percentage
See Forex Risk Management for position-sizing principles.
For gold traders, How to Trade Gold XAUUSD shows how market structure can fit into a defined trade process.
Practice one setup on historical charts and record the market, timeframe, level, trigger, stop distance, result, and screenshot.
Paper trading can help with chart reading and rule execution. Live trading adds spreads, slippage, and emotional pressure.
Keep the rules stable while testing. Changing the setup after every loss makes the results difficult to interpret.
Price action becomes harder during tight ranges, thin liquidity, or sudden news. Major economic releases can create long candles that look like clean breakouts and then reverse.
Check the economic calendar before trading. The CFTC’s forex advisory warns that leveraged OTC forex can create large losses.
Before entering, ask:
- What is the higher-timeframe structure?
- Where is the key level?
- What exactly confirms the entry?
- Where is the trade invalidated?
- How much can I lose if the stop is hit?
Risk Disclaimer
Trading forex carries substantial risk, and leverage can magnify losses. Past performance does not guarantee future results. Use proper risk management and only trade capital you can afford to lose.
FAQ
What are the best Price Action Forex patterns for beginners?
Start with a small group: engulfing candles, pin bars, and inside bars. Use them at clear support or resistance and within market structure. A pattern by itself is not enough; location, confirmation, invalidation, and risk still matter.
Is Price Action Forex better than indicators?
Neither approach is universally better. Price action reads raw movement directly, while indicators calculate signals from market data. Some traders combine both. The useful test is whether your method is clear enough to follow and evaluate consistently.
Can Price Action Forex work on short timeframes?
Yes, but short timeframes contain more noise and faster moves. Use a higher timeframe for context, then a lower timeframe for execution. Keep the stop and position size tied to the actual setup rather than forcing a fixed lot size.
Conclusion
Price Action Forex is not about memorizing dozens of candle names. It is about reading location, structure, reaction, and invalidation in the correct order.
Start with clean charts. Mark major swings. Study key levels. Wait for one clear trigger. Then calculate risk before placing the order.
Over time, the chart can become easier to read because your questions become more specific.
Price Action Forex gives you a framework for reading price. It does not remove uncertainty.