
Last Updated: September 30, 2026
Table of Contents
Introduction
Live Forex Charts turn changing currency prices into a visual record you can study candle by candle. A useful chart read begins with the currency pair, timeframe, candle structure, trend, important levels, and trading costs.
TradingView provides live currency charts for major pairs and multiple timeframes. A chart records price; it does not predict the next candle.
What Live Forex Charts Show
Every forex chart combines price and time. The vertical axis shows the exchange rate, while the horizontal axis shows when prices occurred.
Start with the pair. In EUR/USD, EUR is the base currency and USD is the quote currency.
Candlesticks show four prices: open, high, low, and close. The body shows the open-to-close move; wicks show the extremes.
Read the candle, then read its location. A bullish candle in the middle of a range tells you less than the same candle rejecting a well-tested support area.
Read Candlesticks
Candles show how price behaved during one selected period.
A large bullish body can show strong buying pressure. Long wicks can show rejection from an extreme.
Don’t memorize dozens of names. Start with three observations:
- Large body: one side controlled more of the period.
- Long wick: price was rejected from an extreme.
- Small body: neither side clearly dominated.
For Live Forex Charts, context matters more than the pattern name. A bullish engulfing candle against a strong downtrend is not the same setup as one at established support.
Choose the Right Timeframe
Timeframe changes the amount of noise you see.
A 1-minute chart exposes many short-term fluctuations. A 15-minute chart compresses some movement, while a 1-hour or 4-hour chart reveals broader structure.
Multiple timeframes can make chart analysis easier.
Example:
1H: identify the broader structure.
15M: locate the setup.
5M: refine the entry trigger.
The exact combination is flexible. Use the higher timeframe for context and the lower timeframe for execution.
Find Trend and Key Levels
Trend comes from swing structure, not from one green or red candle.
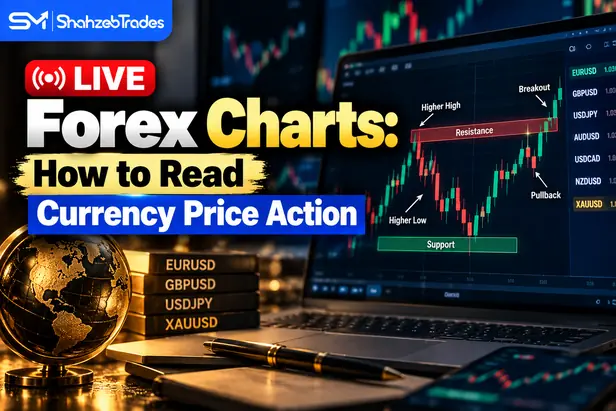
An uptrend commonly forms higher highs and higher lows. A downtrend forms lower highs and lower lows. A range keeps rotating between recognizable boundaries.
Treat support and resistance as areas. Mark meaningful swing points and previous reactions.
A close beyond resistance can carry more information than a wick through it. A quick move above a level followed by a close back inside can show rejection.
For Live Forex Charts, location often matters more than pattern labels.
Use a Simple Price-Action Workflow
A practical sequence is:
Pair → timeframe → structure → level → trigger → invalidation → risk
Suppose EUR/USD is trending higher on the 1-hour chart. Price pulls back into previous support on the 15-minute chart. On the 5-minute chart, buyers push price back above the zone and a bullish candle closes.
That is a setup to evaluate, not an automatic trade.
Ask where the idea becomes wrong. Then calculate position size from your chosen risk limit.
Investor.gov warns that leverage can magnify forex losses and that transaction costs can turn otherwise profitable trades into losses. Check the Investor.gov forex guidance.
Use Forex Risk Management to keep the risk calculation separate from the chart signal.
Avoid Common Chart Mistakes
Live Forex Charts can look simple while the decisions behind them are not.
Watch for:
- Entering before the candle closes.
- Drawing so many levels that every price looks important.
- Switching timeframes until a preferred signal appears.
- Using the same lot size regardless of stop distance.
- Ignoring spread and slippage.
- Treating an indicator as a replacement for price structure.
Your broker’s bid, ask, spread, data feed, and trading hours can differ from another platform.
For broader learning, see Forex Trading for Beginners and Trading Tools.
The CFTC warns that leveraged OTC forex can result in substantial losses. Read its forex customer advisory.
A Quick Chart-Reading Routine
Open Live Forex Charts and ask:
- Which pair am I reading?
- What timeframe gives me context?
- Is price trending or ranging?
- Where are the nearest meaningful zones?
- What exactly confirms the setup?
- Where is the trade invalidated?
- How much can I lose?
If the answers are unclear, wait.
Risk Disclaimer
Forex trading carries substantial risk. Leverage can magnify losses, while spreads, slippage, liquidity changes, and fast markets can affect execution. The examples here are educational only and are not personalized financial advice. Use only risk capital you can afford to lose.
FAQ
What are Live Forex Charts used for?
Live Forex Charts let traders monitor currency prices, compare timeframes, study candlesticks, identify structure, and mark support and resistance as the market moves. They are a charting tool, not a guarantee of future price direction.
How do you read Live Forex Charts as a beginner?
Start with the currency pair and timeframe. Read the candles, identify the trend or range, mark important support and resistance, then wait for a defined trigger. Finish with an invalidation point and position-size calculation.
Which timeframe is best for forex price action?
There is no universal best timeframe. Higher timeframes can make broader structure easier to see, while lower timeframes show more detail and noise. Many traders combine a higher timeframe for context with a lower timeframe for entry timing.
Conclusion
Live Forex Charts become more useful when you stop treating every candle as a signal.
Start with the pair. Choose a timeframe. Read structure. Mark meaningful levels. Wait for a trigger. Define invalidation. Then size the position from risk.
A chart gives information, not certainty. Turn it into rules you can test and review.